Performance
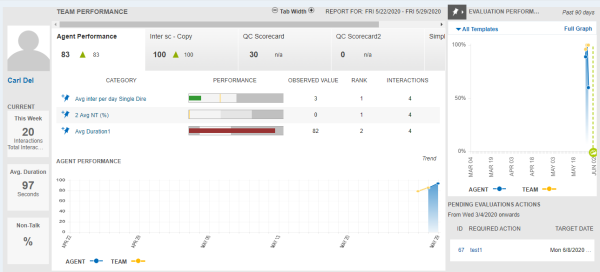
The Dashboard provides a snapshot of your data—for example, how you are performing, performance trends compared to the previous 3 weeks, and compared to your team on the same quality initiatives. The Dashboard tracks performance data week to week. The Report For indicator at the top shows the 7-day period used for compiling the report.
To customize the performance period, use the Nexidia Management Console. For more details, contact your system administrator.
What can you do on the Dashboard?
The Team Performance panel displays pre-defined scorecards. The panel can display up to nine scorecards at a time. To see long scorecard titles, you can change the width of the scorecard tabs using the Tab Width button controls in the top-right of the panel.
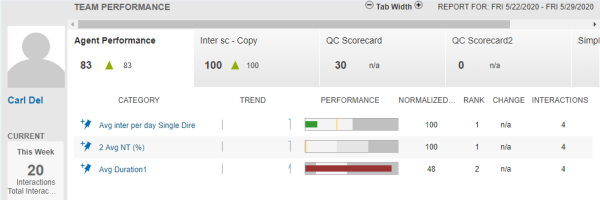
Each scorecard displays team performance parameters with respect to pre-defined KPIs. You can select the required scorecard to list all the specified KPIs and to view the related performance parameters for each KPI. The performance parameters include normalized or observed score, rank, trend chart, and total number of evaluations or interactions. The rank is calculated based on the normalized or observed score. Click the pushpin next to a KPI or category to toggle on or off the Watch List. The Watch List is used to view areas that you may want to keep an eye on. You can click on items to add or remove them from your watch list.

Viewing Normalized Score
Normalized Score is the default displayed score for all type of scorecards. Based on the evaluation scoring method, the actual score is calculated, normalized and then displayed. See Guidelines for Scoring.
The rank is also calculated based on the normalized score and displayed in the dashboard.
Viewing Observed Score
Based on your system configuration, the observed score is displayed in the Team Performance panel.
To view the observed score, your system administrator must select the View Dashboard in Observed score checkbox in the QC Portal under Admin > Settings.
Based on the evaluation and metadata scoring methods, the actual score is calculated and then displayed. This score doesn't get normalized. You must use this score type when you want to view the actual score rather than normalized score. The observed score also helps to calculate the rank accurately. The observed score changes based on the type of goal and threshold range that is specified by your system administrator while defining a scorecard. See Goals.
The following table explains the few possible example scenarios.
|
Goal type and threshold range |
Score |
Rank |
|---|---|---|
| Single Direction with Caution | ||
| Good 0-70 | 55 | 1 |
| Caution 70-100 | 83 | 2 |
| Out of Bound 100 - | 115 | 3 |
| Bi-Direction with Caution | ||
| Out of Bound 0-70 | 65 | -2 |
| Caution 70-100 | 98 | -1 |
| Good 100-110 | 110 | 1 |
| Caution 110-150 | 140 | 2 |
| Out of Bound 150 - | 170 | 3 |
When you view the observed score , the Trend and Change columns are not displayed.
View the trend chart that shows team or agent performance over the current period (7 days):
You can toggle between the observed value and the normalized trend. If a scorecard is selected in the trend, then only the normalized score is available.
Select a category in the Interaction Performance grid to show performance for that category in the Trend chart.
Review your evaluation performance for the past 90 days in the Evaluations Performance area:
Click the pushpin to toggle the Watch List view and the Evaluations Performance view.
The watch list displays only the normalized score related data and doesn't support observed score related data.
View coaching dates represented with a vertical green line with a circle at the end pointing to the date on the x-axis when the coaching took place. When you mouseover the image, a Coaching Provided tool tip displays. You can click the green circle at the end of the green line to display the Coaching window for this item.
Resolve pending actions:
Click the evaluation ID that contains to the pending required action to launch the evaluation.
If the required action is a knowledge base item or a link, you can click to open it. Opening the knowledge base item updates the row in the table to indicate that this item has been completed. It is removed the next time the page is refreshed.
Deadlines displayed in red text are due within 3 days of the current date. The pending coaching action start date is calculated using the past 90 days from the current date.
The pending coaching actions can be seen from 12/10/2019 onwards.
View and play back your interactions (this feature is permission based).
Select and double-click on a Scorecard category column and then click Examples. The Media Player window displays the interactions associated with the scorecard.
To enable Examples, use the Nexidia Management Console. For more details, contact your system administrator.
Click on a specific supported type of file such as .wav, chat or text file to open the recorded interactions. For more information, see Playing Back Interactions.


